
 Craig Bailey
How to Avoid Link Rot
Broken links are a fact of internet life and in recent years the growing number of sites using a CMS such as WordPress and Drupal “have led to the...

If you're new to HubSpot, we guide you on where to start, how to do it right, and train you to make the most of the platform.
Review your HubSpot portal to uncover issues, spot growth opportunities, and ensure you're maximising its potential.
Unlock business growth with automation and attribution. Implement best practices and execute marketing campaigns.
You've probably seen those ads from companies that claim to drive huge volumes of traffic to your site using their 'secret' strategy...
The problem with most of those offerings is that they are usually:
So, this post is written as a warning to anyone who's been tempted by the allure of easy traffic increases. As the saying goes: If it sounds too good to be true, it probably is.
In this post I'm going to walk you through the details of a lucky break we got on one of our sites recently. The traffic really did hit more than 250,000 pageviews (and actually within the space of about a week), and the visitors were real (ie no bots or Fiverr loads here).
But, as I'll detail, the traffic isn't necessarily that useful (ie point 3 above ) - it isn't something that we can easily monetise or convert into any form of customer base. In fact, perhaps the main benefit of all the traffic is that I can write the warning post you're now reading :-)
We'll cover:
If you're not that interested in the process or insights from this, then I'll save you reading. Basically we got lucky:
The site in question is our new XEN Life site at xenlife.com.au.
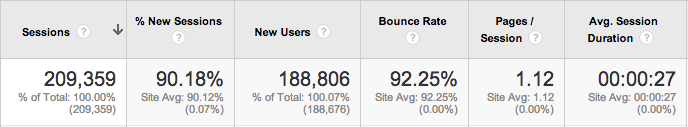
I'll explain what the site is about later in the post, but first, here's some stats. Notice our Sessions and Pageviews.
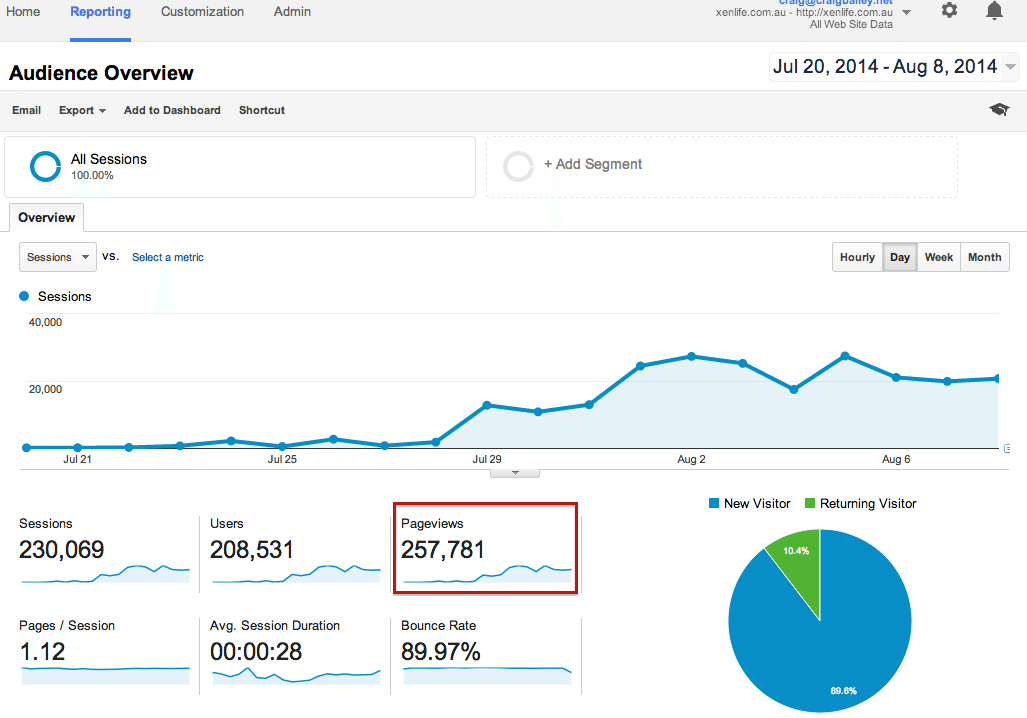
At first glance the stats look impressive, and are the type of results that get trotted out by companies in brochures and presentations.
But be wary - just take a look at that bounce rate! At around 90% it's very high.
Plus, you'll also notice that even though I'm writing this post on 17 August, the graph above goes to 08 August. And there's a reason for that - here's the trend in the week following:
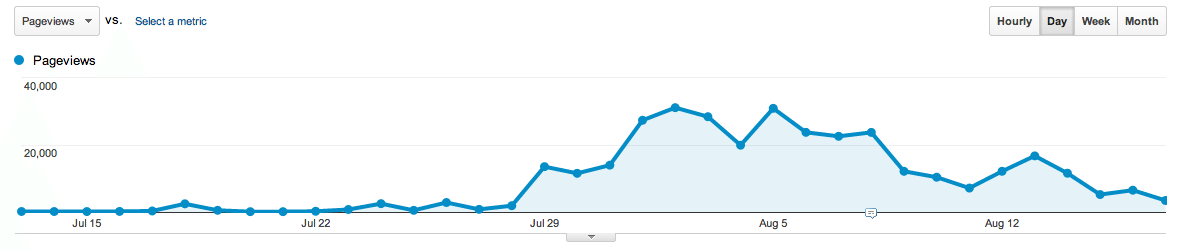
Yep, the traffic drops away sharply. It was a sudden, enjoyable, but unsustainable surge. It was fun while it lasted - but as well all know, past history is no guarantee of future performance...
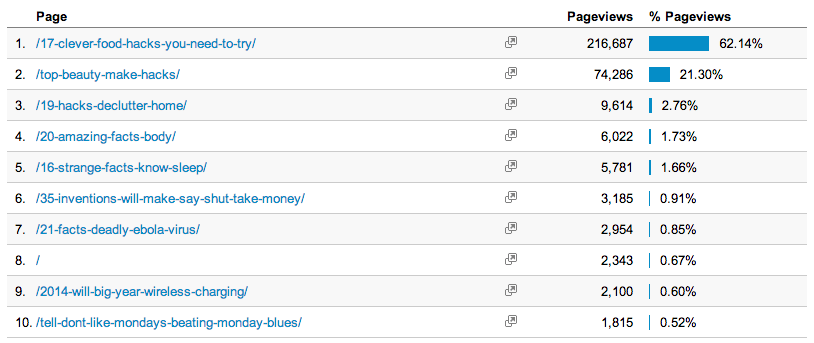
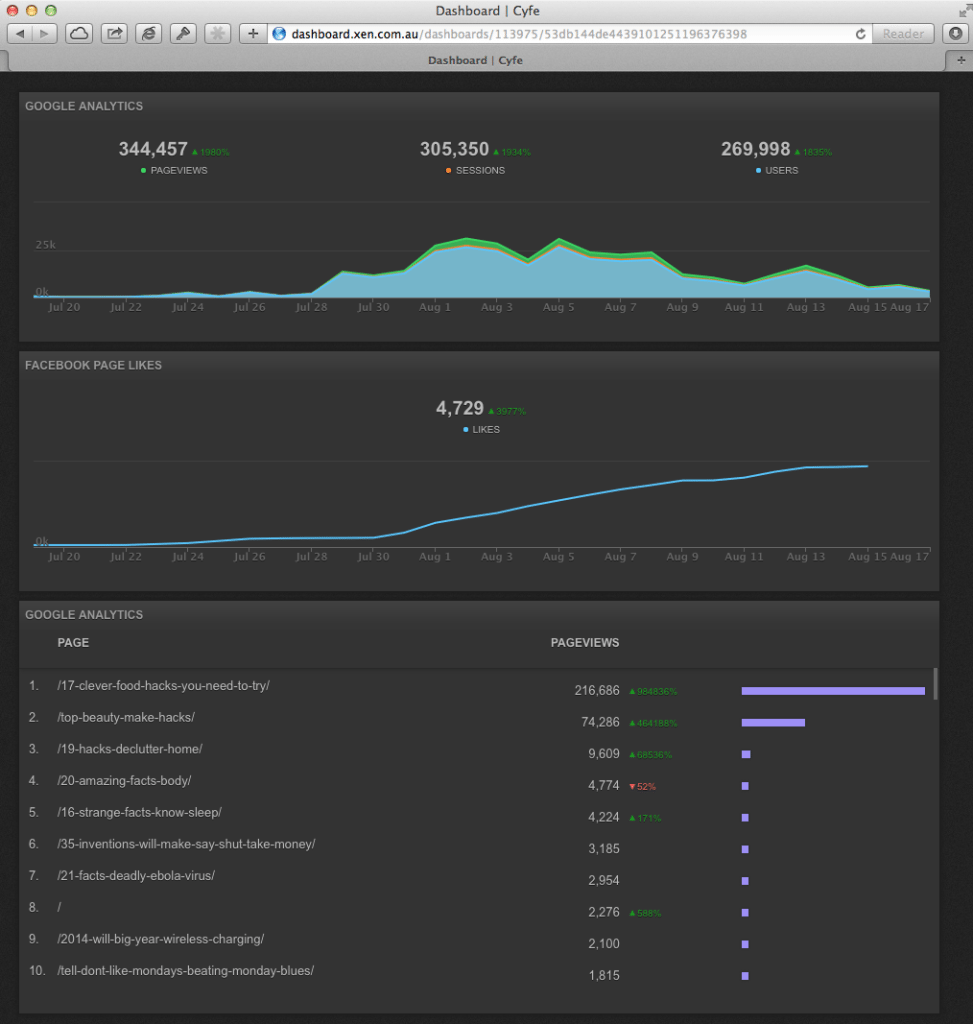
And here's the list of main content - notice that one post in particular is responsible for more than 60% of the pageviews:
So here's the initial message - be wary of sites, companies and special 'systems' that promise you massive traffic increases.
As I'll detail in the rest of the post, there's a few key things you should drill into in order to gauge the real value of the traffic. Some of the items can be checked easily within analytics, but others need to be implemented, tested and analysed.
Before going on though, let's take a step back and quickly discuss what the purpose of the XEN Life site is.
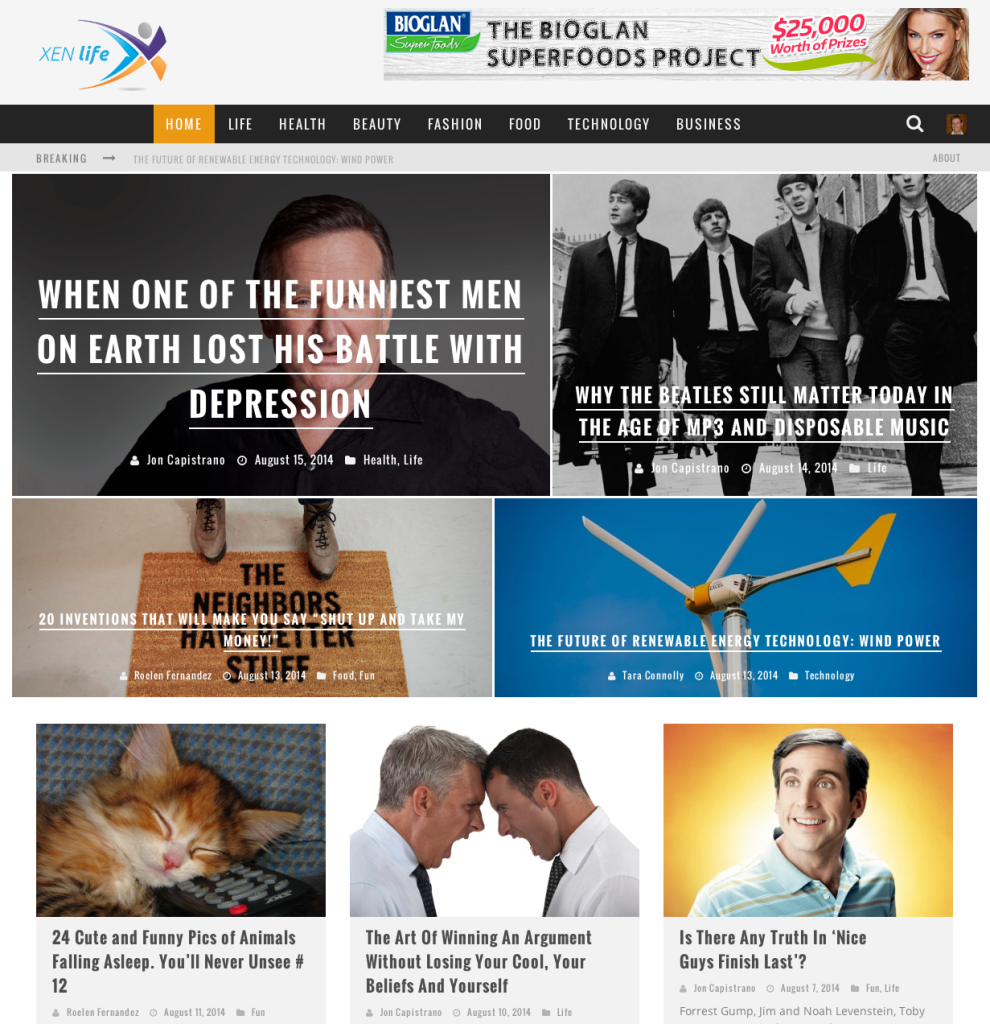
First of all, we're not trying to be a BuzzFeed or HuffPo site (although we do have a few posts in that style). There's plenty of sites doing that already, it's a crowded space, and we don't have the resources (or interest) to be competing there.
Instead the purpose of the site is simply to provide a place to train up our writers.
We have 3 main writers, plus 2 editors, plus an overall SEO research manager - together they work to find topics/keywords/sentiment that is being discussed online, and plan out topics accordingly.
You may think that content creation is a straight forward process, but (like most things online) it's constantly changing - and the content strategies you put in place today won't necessarily be as effective in a few months time. XEN Life is our way of continually testing that, and improving our offering as much as possible in response.
For example, if you were to look at some of our articles from June and compare them to posts in August you'd see a big change in how we've:
It's still being improved, but so far the approach is working very well.
As a company we've been ramping up a lot of our content marketing offerings over the last 12-18 months. To help with selling this service I wanted to use the XEN Life site as a kind of portfolio site to demonstrate our writing on different topics.
eg If a client is in the health/beauty industry we'd point them to posts like this, this, this and this, as examples of the kinds of content we could write for them. And so on, for other areas such as technology, lifestyle, food, fashion, business, etc.
As well as using the site as a means to improve our content creation process, we've also started using it to test our social media approach. Although it wasn't originally going to be a focus, recently we've started putting more effort into the social sharing side of the site, and are using the learnings to help our clients as well.
OK, enough about why we've built the site, now let's get back to how the site has performed.
First up, the overall engagement on the site.
Here's what the bounce rate looked like in the first weeks of the traffic increase (20 July - 07 August):
Notice those bounce rates - most were very high. Visitors were landing on the site but not visiting a second page.
Since the majority of visitors were reading one post and then leaving it was difficult to determine how long the average site duration was. Were visitors leaving straight away, or were they reading for a while and then leaving?
It's only early days yet, and my testing on this front is very rudimentary, but I thought I'd mention progress so far. On August 08 we set up an Adjusted Bounce Rate tweak using Google Tag Manager to fire a timer event every 30 seconds. With that in place we could at least check how many visitors were staying a minimum of 30 seconds.
Turns out, most are - here's the bounce rate graph change (light blue line) after being put in place on 08 August - it drops from high 90%s to between 15-25% bounce rate:
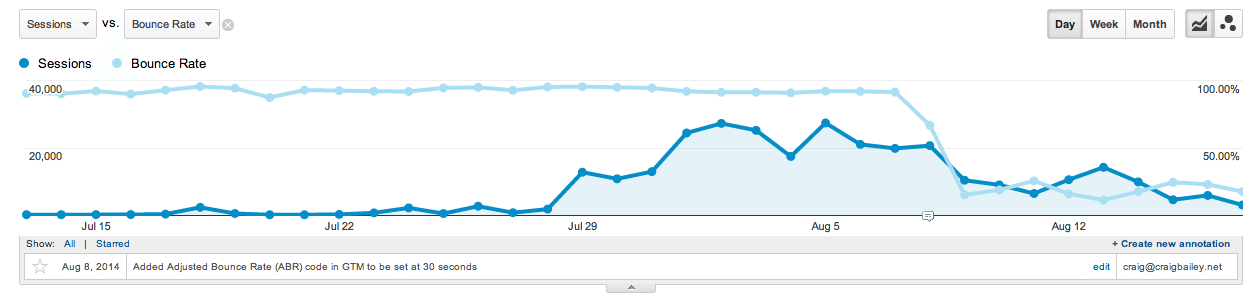
So this indicates that most people are staying for at least 30 seconds. My next test will be to increase the timer to 60 seconds and check response.
Let's drill into the traffic sources.
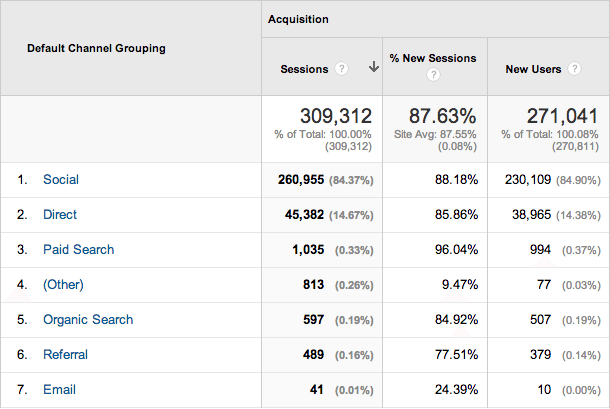
As you can see, most of the traffic has come from Social, in particular Facebook and StumbleUpon:
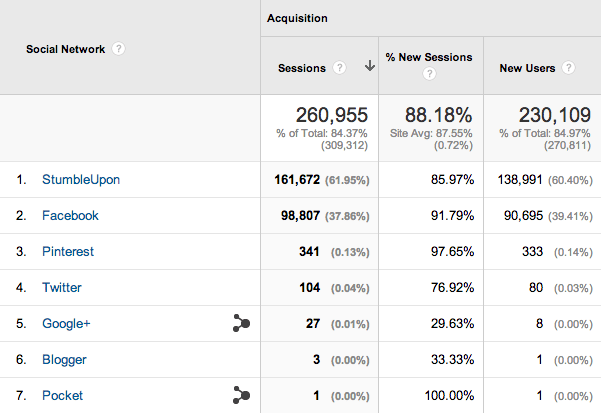
Note: all of that StumbleUpon traffic is organic (we didn't pay for any of it via Paid Discovery)
StumbleUpon turned out to be the catalyst for the site traffic increase.
It started with this post on the site:
http://xenlife.com.au/17-clever-food-hacks-you-need-to-try/
As a general practice after a new post goes live we post it to Twitter, Facebook, Google+, Pinterest and StumbleUpon. At the time I wasn't checking the analytics all that regularly (perhaps only once every few days), so it came as a bit of surprise when I checked analytics one morning and noticed that the post had suddenly had a spike in visits. Turns out that it had gone a little viral on StumbleUpon, reaching 70K stumbles in a few days.
Noticing that it was a post of interest we then decided to test it via some paid advertising on Facebook, and that's when it took off. We tried a few post variations, but this is the one that performed the best:
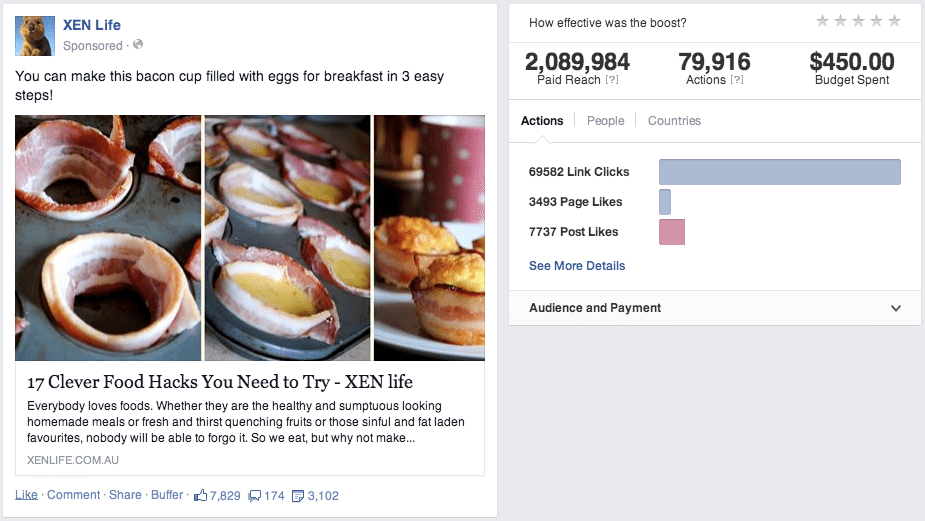
Notice that for our $450 total spend we got a ton of post Likes and Shares, as well as page Likes, plus almost 70,000 visits to the site. This is one of the most effective ad spends I've ever had on Facebook. If only I could regularly get this kind of response!
btw here's the total stats for that post as of today:

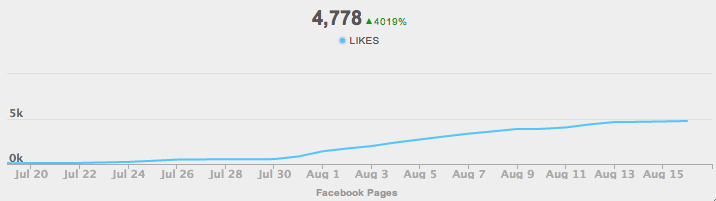
And here's the overall growth in our Facebook XEN Life Page Likes:
https://www.facebook.com/XENLife
And that's the basis for how the site generated all that traffic. We got lucky with a StumbleUpon surge, which we then used to feed our Facebook traffic, which in turn drove traffic to other pages as well.
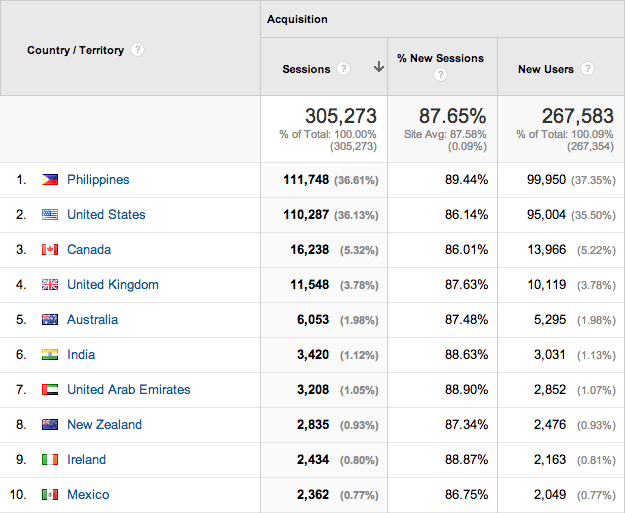
The following lists the locations of the visitors:
And further, the sources by location:
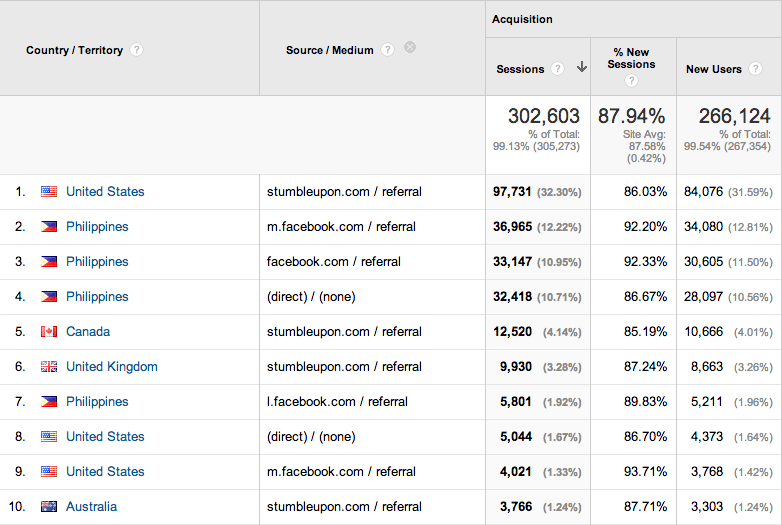
StumbleUpon was big in the US, whereas Facebook had much more traction in the Philippines.
At XEN we have both local (in Australia) and outsourced (Philippines) staff, so it's not surprising that the Philippines took off as part of our Facebook promotions.
However it does highlight the need to drill into your reports when assessing traffic value (and the claims of companies or services that promote their traffic systems). If the traffic is coming from sources and locations you don't deem as your target market, you need to think through whether the strategy being used is the right one.
OK, so that's the overview of how we got the traffic, next up is some of the things we tested once the traffic was on the site.
One of the advantages of having a sudden increase in traffic is that it allows you to test a bunch of things. So when the traffic was rising we tested the following:
I was interested to see how effective popups and slide ups would be. We used OptinMonster to test a few offers.
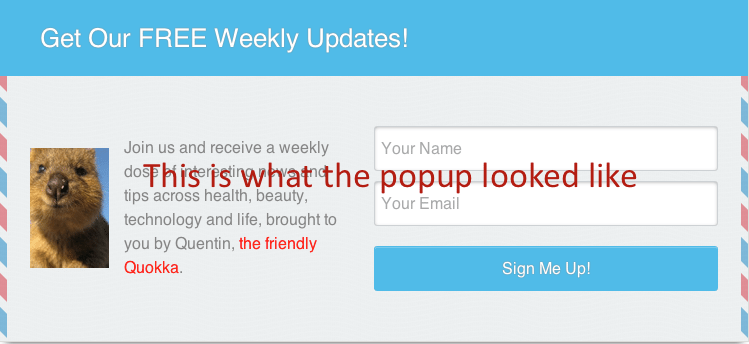
The first was an encouragement to sign up for a newsletter (using a simple MailChimp account we quickly set up). The results weren't great. Part of the issue is that the newsletter offer wasn't particularly compelling (after all we didn't have any free ebook or anything to give away), so the popup looked like this (we had a few variations):
Here's the results:
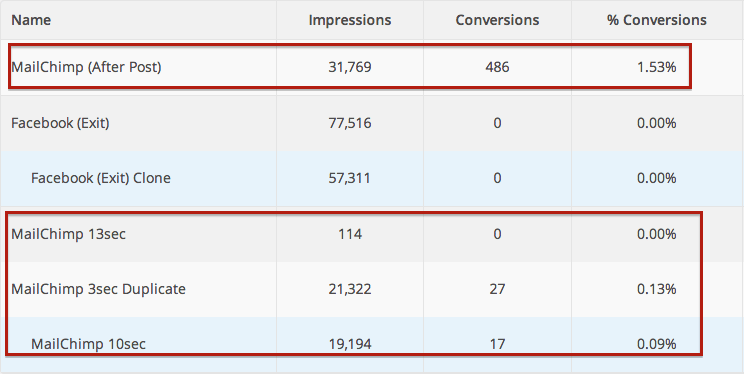
Ignore the Facebook tests (we'll come to those next) and focus on the 3 main MailChimp tests.
We first tested Showing the MailChimp popup after 3 seconds, and then 10 seconds, and the briefly 13 seconds. The % Conversion rate tells you everything you need to know there - very low conversions.
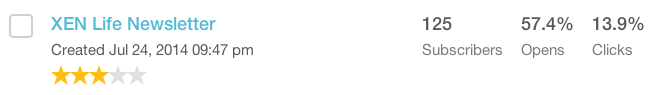
Next we turned those off and instead just showed the newsletter offer after each post (ie no popup). The conversion rate there was much better (1.53% according to the stats) however that wasn't the real story. Because the MailChimp list is double opt in, the number of conversions above (486) only indicates how many people filled in the form on the site. It doesn't show how many people actually confirmed their subscription. According to MailChimp, only 125 people actually confirmed:
(As an aside - that's something else to test - how to improve the double opt in signup rate)
So putting that all together, it means out of the 72,399 impressions the MailChimp test resulted in only 125 subscribers or roughly 1 subscriber per 579 impressions (0.17%). And then of course out of those subscribers not all of them open or click on an email anyway, so the overall reach is even lower.
Not that this is particularly surprising though - after all how many 'fun' web sites do you sign up to receive emails from? Me, hardly ever. I'm guessing you're the same.
Summary: Newsletter signups were tiny.
So with email signups not responding well, we tried Facebook Like requests...
The Facebook Like popup looked like this:

We tested this with both time delays and on exit intent (ie if a visitor moves their mouse out of the main browser window).
OptinMonster can't catch the conversions from this since there's no landing page involved (which is why the conversion numbers showed zeros in the earlier screenshot) so we had to crosscheck the FB Likes overall, subtracted from the FB Likes we got from within Facebook itself.
Helpfully, Facebook Insights shows this in their standard reports - here's what the XEN Life stats look like:
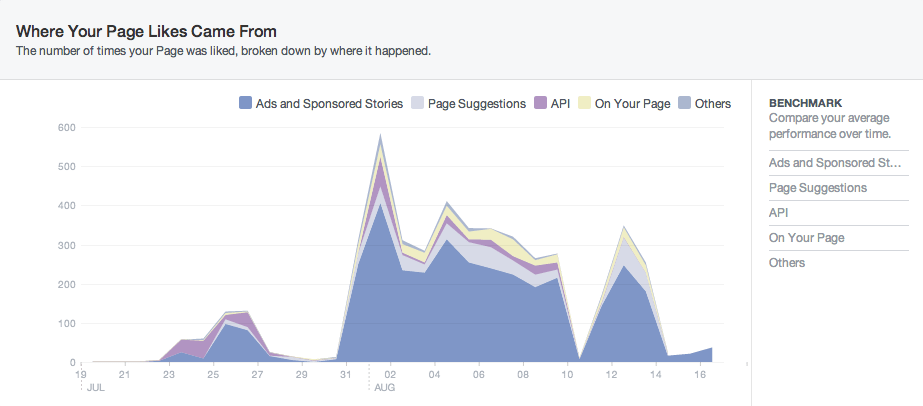
By far the majority are coming from within Facebook (Ads, Sponsored stories, On Your Page), leaving us with just the API and Others
And drilling into the 'API' stats here's what we find:
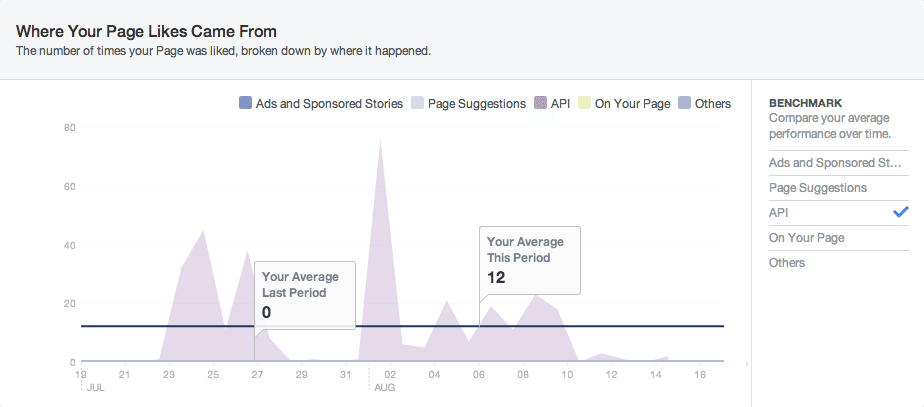
The 'Others' section was even smaller. I'm not entirely sure which of these sections indicate the Likes that come from the site itself (leave a comment if you know), but either way the total volume is tiny. Which is the main point to note.
Summary: on site popups urging visitors to Like our Facebook page weren't very successful.
Next we tested click throughs from the site - the thinking being that it would be interesting to test what the likely results from advertising might be (eg if we added an AdSense banner). To that end we added a banner to the top of the site:

(Disclaimer: Bioglan is one of our clients, and we're currently helping them with their Superfoods Project campaign. The banner is nofollowed.)
Given that the majority of the traffic to the site is staying for a little while (at least 30 seconds), I wanted to see whether they would click through to another site when they'd finished. Given that the banner is at the top of the site, and most visitors would be unlikely to scroll back to the top if they were finished, I expected the click throughs to be low. (In a future experiment I might test putting the banner at the end of a post).
Here's the results based on clicks of the banner (set up via a Link Click Event listener in Google Tag Manager to tracked the pages it was clicked from):
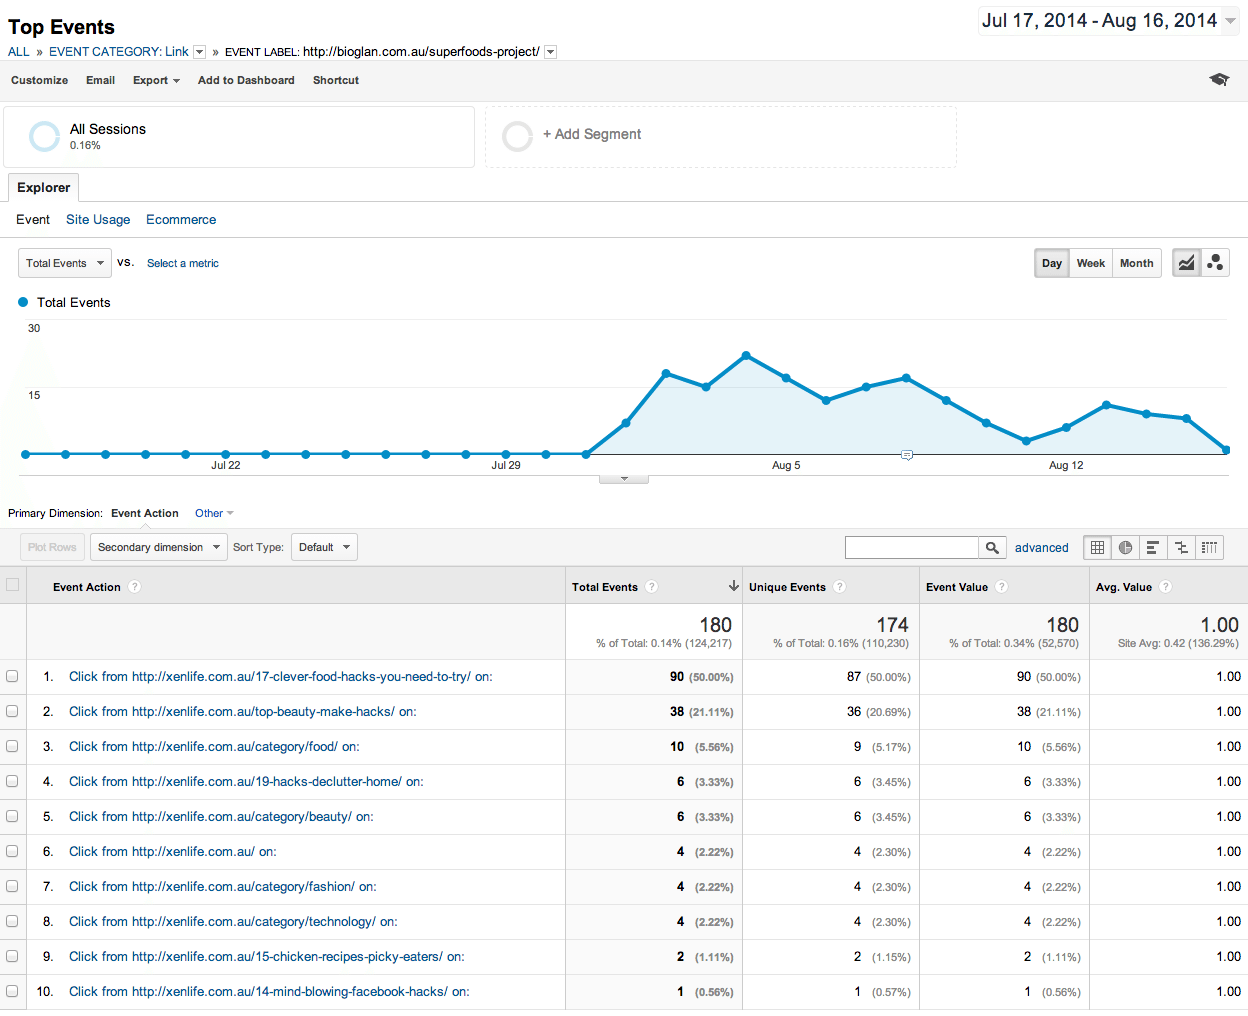
This was put in place on 01 August, and in the 16 days since then it has received a total of 180 clicks. We've had 258,147 sessions in that timeframe, meaning a click through rate of 0.07% (ie minuscule!)
Interestingly, the people that did click through were reasonably engaged on the destination site (Bioglan) - but I don't have permission to share those stats as yet (I'll update this post when and if I get permission).
Summary: Banner ad click through rates are tiny.
Next: I'll try testing placement at the bottom of a post to see the effect on click-throughs.
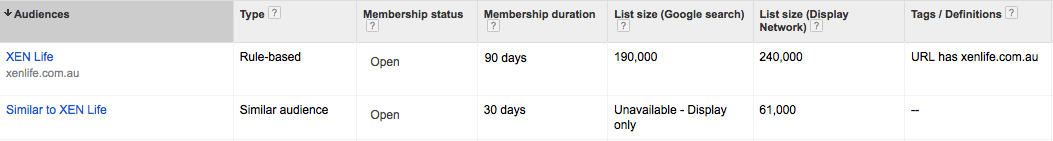
Given that we were getting a ton of visits we set up an AdWords remarketing tag - so that we could then test whether remarketing to this audience was worthwhile. The current remarketing list is now at 240,000:
With that in mind we created an initial campaign:
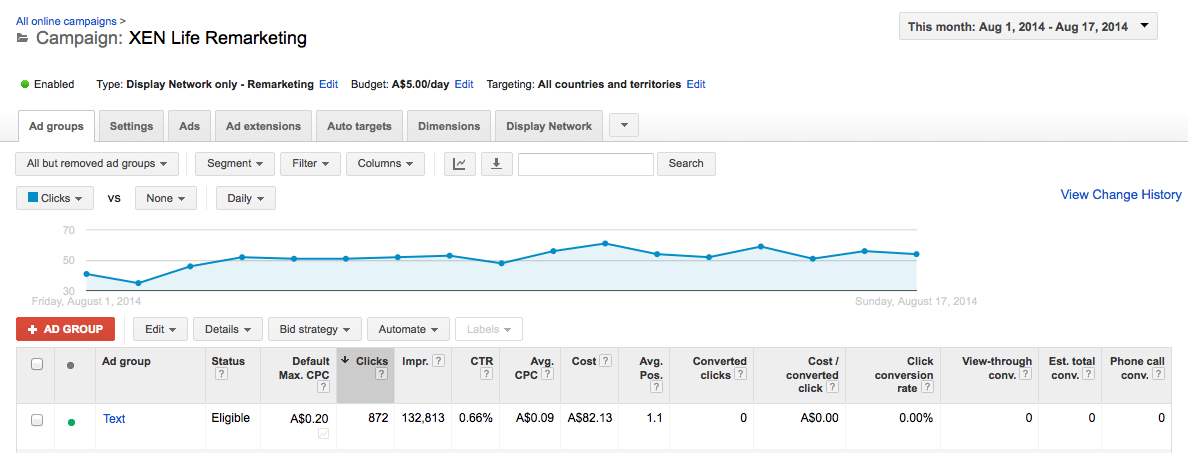
Here's the results of a few ads for the past 7 days: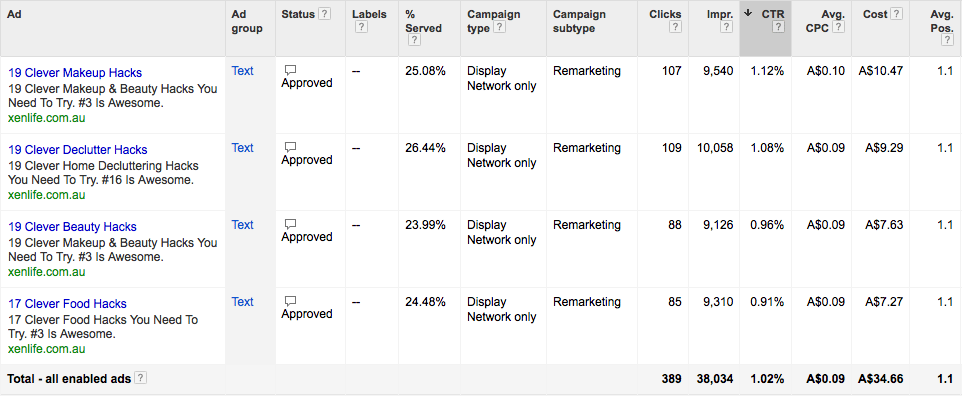
The clicks were good (a CTR over 1% on display is generally pretty good), the prices were cheap (avg 0.09) and drove reasonably engaged traffic:
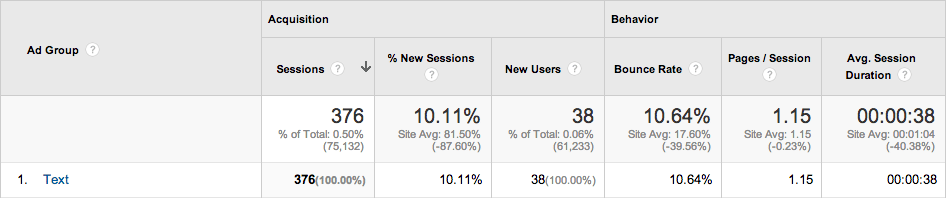
Note: keep in mind that the site has adjusted bounce rate in place (see earlier) and hence the bounce rate is indicative only of visitors who didn't last 30 seconds.
So, this is indicating that most visitors (ie approx 90%) returning via remarketing are staying for at least 30 seconds.
And thus remarking (especially at these prices) would likely be a viable source of traffic (if we wanted to gain more traffic).
As you can likely tell a lot of the testing above was done quickly and reactively. Ideally if we'd been a bit more proactive we'd have set up proper Analytics goals for tracking:
and then we could have further drilled into things like:
One thing that I'm thankful for is that we're hosting with WP Engine (and no, that's not an affiliate link). The site had no problems with performance when the traffic ramped up.
I've created a simple public dashboard you can use to keep track of progress (if you are interested):
There's a few main points from this experience:
And thus, here's the key points I hope you'll takeaway:
I hope you've found this interesting - feel free to ask any questions in the comments and I'll do my best to answer them.

And if you're after a quick read about an incredibly cute animal, check out our Quokkas post here.
Thanks for reading.